|
Energie Welt |
|
|
|
Energie Informationen |
|
|
|
|
|
Klimaerwärmung
durch Treibhausgase |
|
IEA: Nordamerika führend in einer globalen Umwälzung des Energiemarkts
|
 |
Eine neue globale Energielandschaft entsteht
Die Weltkarte der Energiewirtschaft verändert sich, was möglicherweise weitreichende Konsequenzen für Energiemärkte und Energiehandel hat. Sie verändert sich infolge der wiedererstarkten Öl-und Gasförderung in den Vereinigten Staaten, und sie könnte sich unter dem Einfluss des Rückzugs einer Reihe von Ländern aus der Kernenergie, des weiterhin raschen Wachstums der Nutzung von Wind-und Solartechnologien sowie der weltweiten Expansion der unkonventionellen Gasförderung weiter verändern.
Die Aussichten für die internationalen Ölmärkte hängen davon ab, inwieweit es dem Irak gelingt, seine Ölwirtschaft wieder auf die Beine zu stellen. Wenn im Rahmen konzertierter Anstrengungen zur Steigerung der weltweiten Energieeffizienz neue Initiativen ausgeweitet und umgesetzt werden, so könnte dies ebenfalls eine grundlegende Veränderung der Situation bewirken.
Ausgehend von globalen Szenarien und verschiedenen Fallstudien wird in diesem World Energy Outlook (Weltenergieausblick) untersucht, welche Auswirkungen diese neuen Entwicklungen auf die globalen Energie-und Klimatrends in den kommenden Jahrzehnten haben könnten. Dabei wird ihr Effekt auf die entscheidenden Herausforderungen analysiert, vor denen das Energiesystem steht: die Deckung des stetig wachsenden weltweiten Energiebedarfs - vor allem infolge steigender Einkommen und Bevölkerungszahlen in den aufstrebenden Volkswirtschaften -, die Sicherung des Zugangs zu Energie für die ärmsten Bevölkerungsgruppen der Welt und die Erfüllung der Klimaschutzziele.
INTERNATIONALE ENERGIE-AGENTUR
Die Internationale Energie-Agentur (IEA) wurde im November 1974 als autonome Institution gegründet. Ihr Hauptauftrag war - und ist - zweigeteilt: die Energieversorgungssicherheit ihrer Mitgliedsländer durch gemeinsame Massnahmen zur Bewältigung von physischen Störungen der Ölversorgung zu fördern und massgebliche Forschungsarbeiten und Analysen dazu zu liefern, wie eine verlässliche, erschwingliche und saubere Energieversorgung in ihren 28 Mitgliedsländern und darüber hinaus sichergestellt werden kann. Die IEA führt ein umfassendes Programm zur Energiekooperation zwischen ihren Mitgliedsländern durch, die alle verpflichtet sind, Ölvorräte im Umfang ihrer Nettoölimporte von 90 Tagen zu halten.
Die grundlegenden Ziele der IEA lauten wie folgt:
- Sicherung des Zugangs der Mitgliedsländer zu einer verlässlichen und umfassenden Versorgung mit allen Energieformen, insbesondere durch Aufrechterhaltung effektiver Krisenkapazitäten zur Bewältigung von Störungen der Ölversorgung.
- Förderung nachhaltiger energiepolitischer Massnahmen, die Wirtschaftswachstum und Umweltschutz in einem globalen Kontext antreiben - vor allem in Bezug auf die Reduzierung der zum Klimawandel beitragenden Treibhausgasemissionen.
- Verbesserung der Transparenz der internationalen Märkte durch Erfassung und Analyse von Energiedaten.
- Unterstützung der weltweiten Zusammenarbeit im Bereich der Energietechnologie zur Sicherung der künftigen Energieversorgung und Verringerung ihrer Auswirkungen auf die Umwelt, u.a. durch eine Steigerung der Energieeffizienz sowie die Entwicklung und Markteinführung von CO2-armen Technologien.
- Ausarbeitung von Lösungen für globale Energieherausforderungen durch Zusammenarbeit und Dialog mit Nichtmitgliedsländern, Wirtschaft, internationalen Organisationen und sonstigen Akteuren.
Die IEA-Mitgliedsländer sind:
Australien Belgien Dänemark Deutschland Finnland Frankreich Griechenland Irland Italien Japan Kanada Republik Korea Luxemburg Neuseeland Niederlande Norwegen Österreich Polen Portugal Schweden Schweiz Slowakische Republik Spanien Tschechische RepublikTürkeiVereinigte Staaten Die Europäische Kommission
 |
Quelle:
Internationale Energie-Agentur (IEA), Dezember 2012
|
nach
oben
|
North America leads shift in global energy balance
|
|
The global energy map is changing in dramatic fashion, the International Energy Agency said as it launched the 2012 edition of the World Energy Outlook (WEO). The Agency's flagship publication, released today in London, said these changes will recast expectations about the role of different countries, regions and fuels in the global energy system over the coming decades.
 |
|
"North America is at the forefront of a sweeping transformation in oil and gas production that will affect all regions of the world, yet the potential also exists for a similarly transformative shift in global energy efficiency," said IEA Executive Director Maria van der Hoeven. "This year's World Energy Outlook shows that by 2035, we can achieve energy savings equivalent to nearly a fifth of global demand in 2010. In other words, energy efficiency is just as important as unconstrained energy supply, and increased action on efficiency can serve as a unifying energy policy that brings multiple benefits."
The WEO finds that the extraordinary growth in oil and natural gas output in the United States will mean a sea-change in global energy flows.
|
|
|
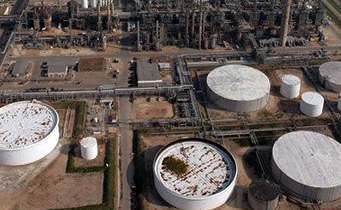 |
| In the New Policies Scenario, the WEO's central scenario, the United States becomes a net exporter of natural gas by 2020 and is almost self-sufficient in energy, in net terms, by 2035. North America emerges as a net oil exporter, accelerating the switch in direction of international oil trade, with almost 90% of Middle Eastern oil exports being drawn to Asia by 2035. Links between regional gas markets will strengthen as liquefied natural gas trade becomes more flexible and contract terms evolve. |
|
While regional dynamics change, global energy demand will push ever higher, growing by more than one-third to 2035. China, India and the Middle East account for 60% of the growth; demand barely rises in the OECD, but there is a pronounced shift towards gas and renewables.
Fossil fuels will remain dominant in the global energy mix, supported by subsidies that, in 2011, jumped by almost 30% to $523 billion, due mainly to increases in the Middle East and North Africa. Global oil demand grows by 7 mb/d to 2020 and exceeds 99 mb/d in 2035, by which time oil prices reach $125/barrel in real terms (over $215/barrel in nominal terms). A surge in unconventional and deepwater oil boosts non-OPEC supply over the current decade, but the world relies increasingly on OPEC after 2020. Iraq accounts for 45% of the growth in global oil production to 2035 and becomes the second-largest global oil exporter, overtaking Russia.
While the regional picture for natural gas varies, the global outlook over the coming decades looks to be bright, as demand increases by 50% to 5 trillion cubic metres in 2035. Nearly half of the increase in production to 2035 is from unconventional gas, with most of this coming from the United States, Australia and China. Whether demand for coal carries on rising strongly or changes course radically will depend on the strength of policy decisions around lower-emissions energy sources and changes in the price of coal relative to natural gas. In the New Policies Scenario, global coal demand increases by 21% and is heavily focused in China and India.
Renewables become the world's second-largest source of power generation by 2015 and close in on coal as the primary source by 2035. However, this rapid increase hinges critically on continued subsidies. In 2011, these subsidies (including for biofuels) amounted to $88 billion, but over the period to 2035 need to amount to $4.8 trillion; over half of this has already been committed to existing projects or is needed to meet 2020 targets. Ambitions for nuclear have been scaled back as countries have reviewed policies following the accident at Fukushima Daiichi, but capacity is still projected to rise, led by China, Korea, India and Russia.
Water is essential to the production of energy, and the energy sector already accounts for 15% of the world's total water use. Its needs are set to grow, making water an increasingly important criterion for assessing the viability of energy projects. In some regions, water constraints are already affecting the reliability of existing operations and they will introduce additional costs. Expanding power generation and biofuels output underpin an 85% increase in the amount consumed (the volume of water that is not returned to its source after use) through to 2035.
"Our analysis shows that in the absence of a concerted policy push, two-thirds of the economically viable potential to improve energy efficiency will remain unrealised through to 2035. Action to improve energy efficiency could delay the complete 'lock-in' of the allowable emissions of carbon dioxide under a 2°C trajectory - which is currently set to happen in 2017 - until 2022, buying time to secure a much-needed global climate agreement. It would also bring substantial energy security and economic benefits, including cutting fuel bills by 20% on average," said Fatih Birol, IEA Chief Economist and the WEO's lead author.
WEO-2012 presents the results of an Efficient World Scenario, which shows what energy efficiency improvements can be achieved simply by adopting measures that are justified in economic terms. Greater efforts on energy efficiency would cut the growth in global energy demand by half. Global oil demand would peak before 2020 and be almost 13 mb/d lower by 2035, a reduction equal to the current production of Russia and Norway combined. The accrued resources would facilitate a gradual reorientation of the global economy, boosting cumulative economic output to 2035 by $18 trillion, with the biggest gains in India, China, the United States and Europe.
|
Quelle:
International Energy Agency (IEA), December 2012
|
nach
oben
|
Grafiken |
|
nach
oben
|
World Energy Outlook 2012
|
|
|
| Graphics (English) |
| Presentation to the press |
|

|
nach
oben
|
Weitere Informationen |
|
nach
oben
|
Links |
|
|