| You are here: | RAOnline Home > Travel > Bhutan > Overview > Bhutan information > Climate > Diagrams | Search |
 |
| Bhutan's Climate |
|
 |
| Weather in Bhutan - Bhutan's Climatology |
| Climatology : Mean values |
| Thimphu | Jan | Feb | Mar | Apr | May | Jun | Jul | Aug | Sep | Oct | Nov | Dec |
| Rain mm | 15 | 41 | 23 | 58 | 122 | 246 | 373 | 345 | 155 | 38 | 8 | 3 |
| Temperature maxi (°C) | 18 | 19 | 25 | 28 | 30 | 29 | 29 | 28 | 28 | 27 | 23 | 19 |
| Temperature mini (°C) | 2 | 4 | 7 | 12 | 16 | 19 | 20 | 20 | 19 | 13 | 7 | 3 |
 |
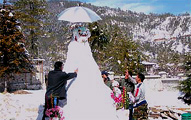
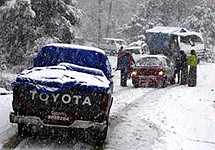
| Snow in Thimphu in January 2003 (Photos: Kuensel) |
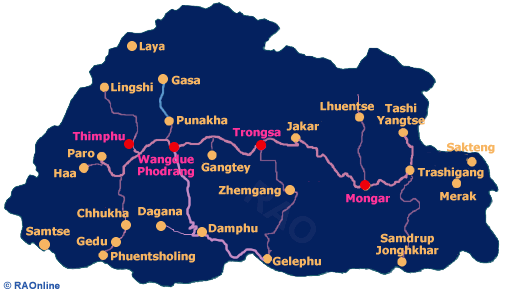
| Stations | Chhukha | Daga | Damphu | Gedu | Samchi | Zhemgang | Thimphu | Trongsa | Wangdi |
| Rain Average Annual cm | 157 | 128 | 182 | 350 | 429 | 174 | 65 | 126 | 64 |
| Temperature maxi (°C) | 27.6 | 25.3 | 23.4 | 23.7 | 32.0 | 20.1 | 25.6 | 21.7 | 28.3 |
| Temperature mini (°C) | 8.7 | 7.5 | 6.5 | 4.2 | 16.3 | 6.4 | -3.8 | -0.1 | 4.6 |
 |
|
|

|
|
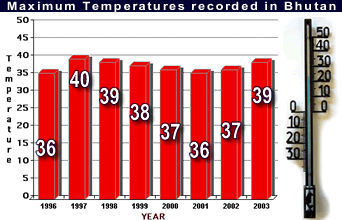 |
In 2003 the maximum temperature was recorded at 39 degrees Celsius in June in Phuentsholing, a 2.5-degree rise compared to June, 2001. Thimphu recorded its maximum temperature on August 6 at 29.5 degrees Celsius. Samdrup Jongkhar, Gelephu and Phuentsholing experienced a fluctuation between 37 to 39 degrees Celsius. |
||

|
|
 |
|
|
|
